# Google Analytics
Admins can set up Google Analytics for greater visibility into what assets are viewed and downloaded.
# Create an Account
If this is your first time using Google Analytics at your institution, you may need to create a Google Analytics account. If you already have an account, skip this step.
Go to analytics.google.com (opens new window) and login.
In the
Adminmenu, choose+ Create > Account.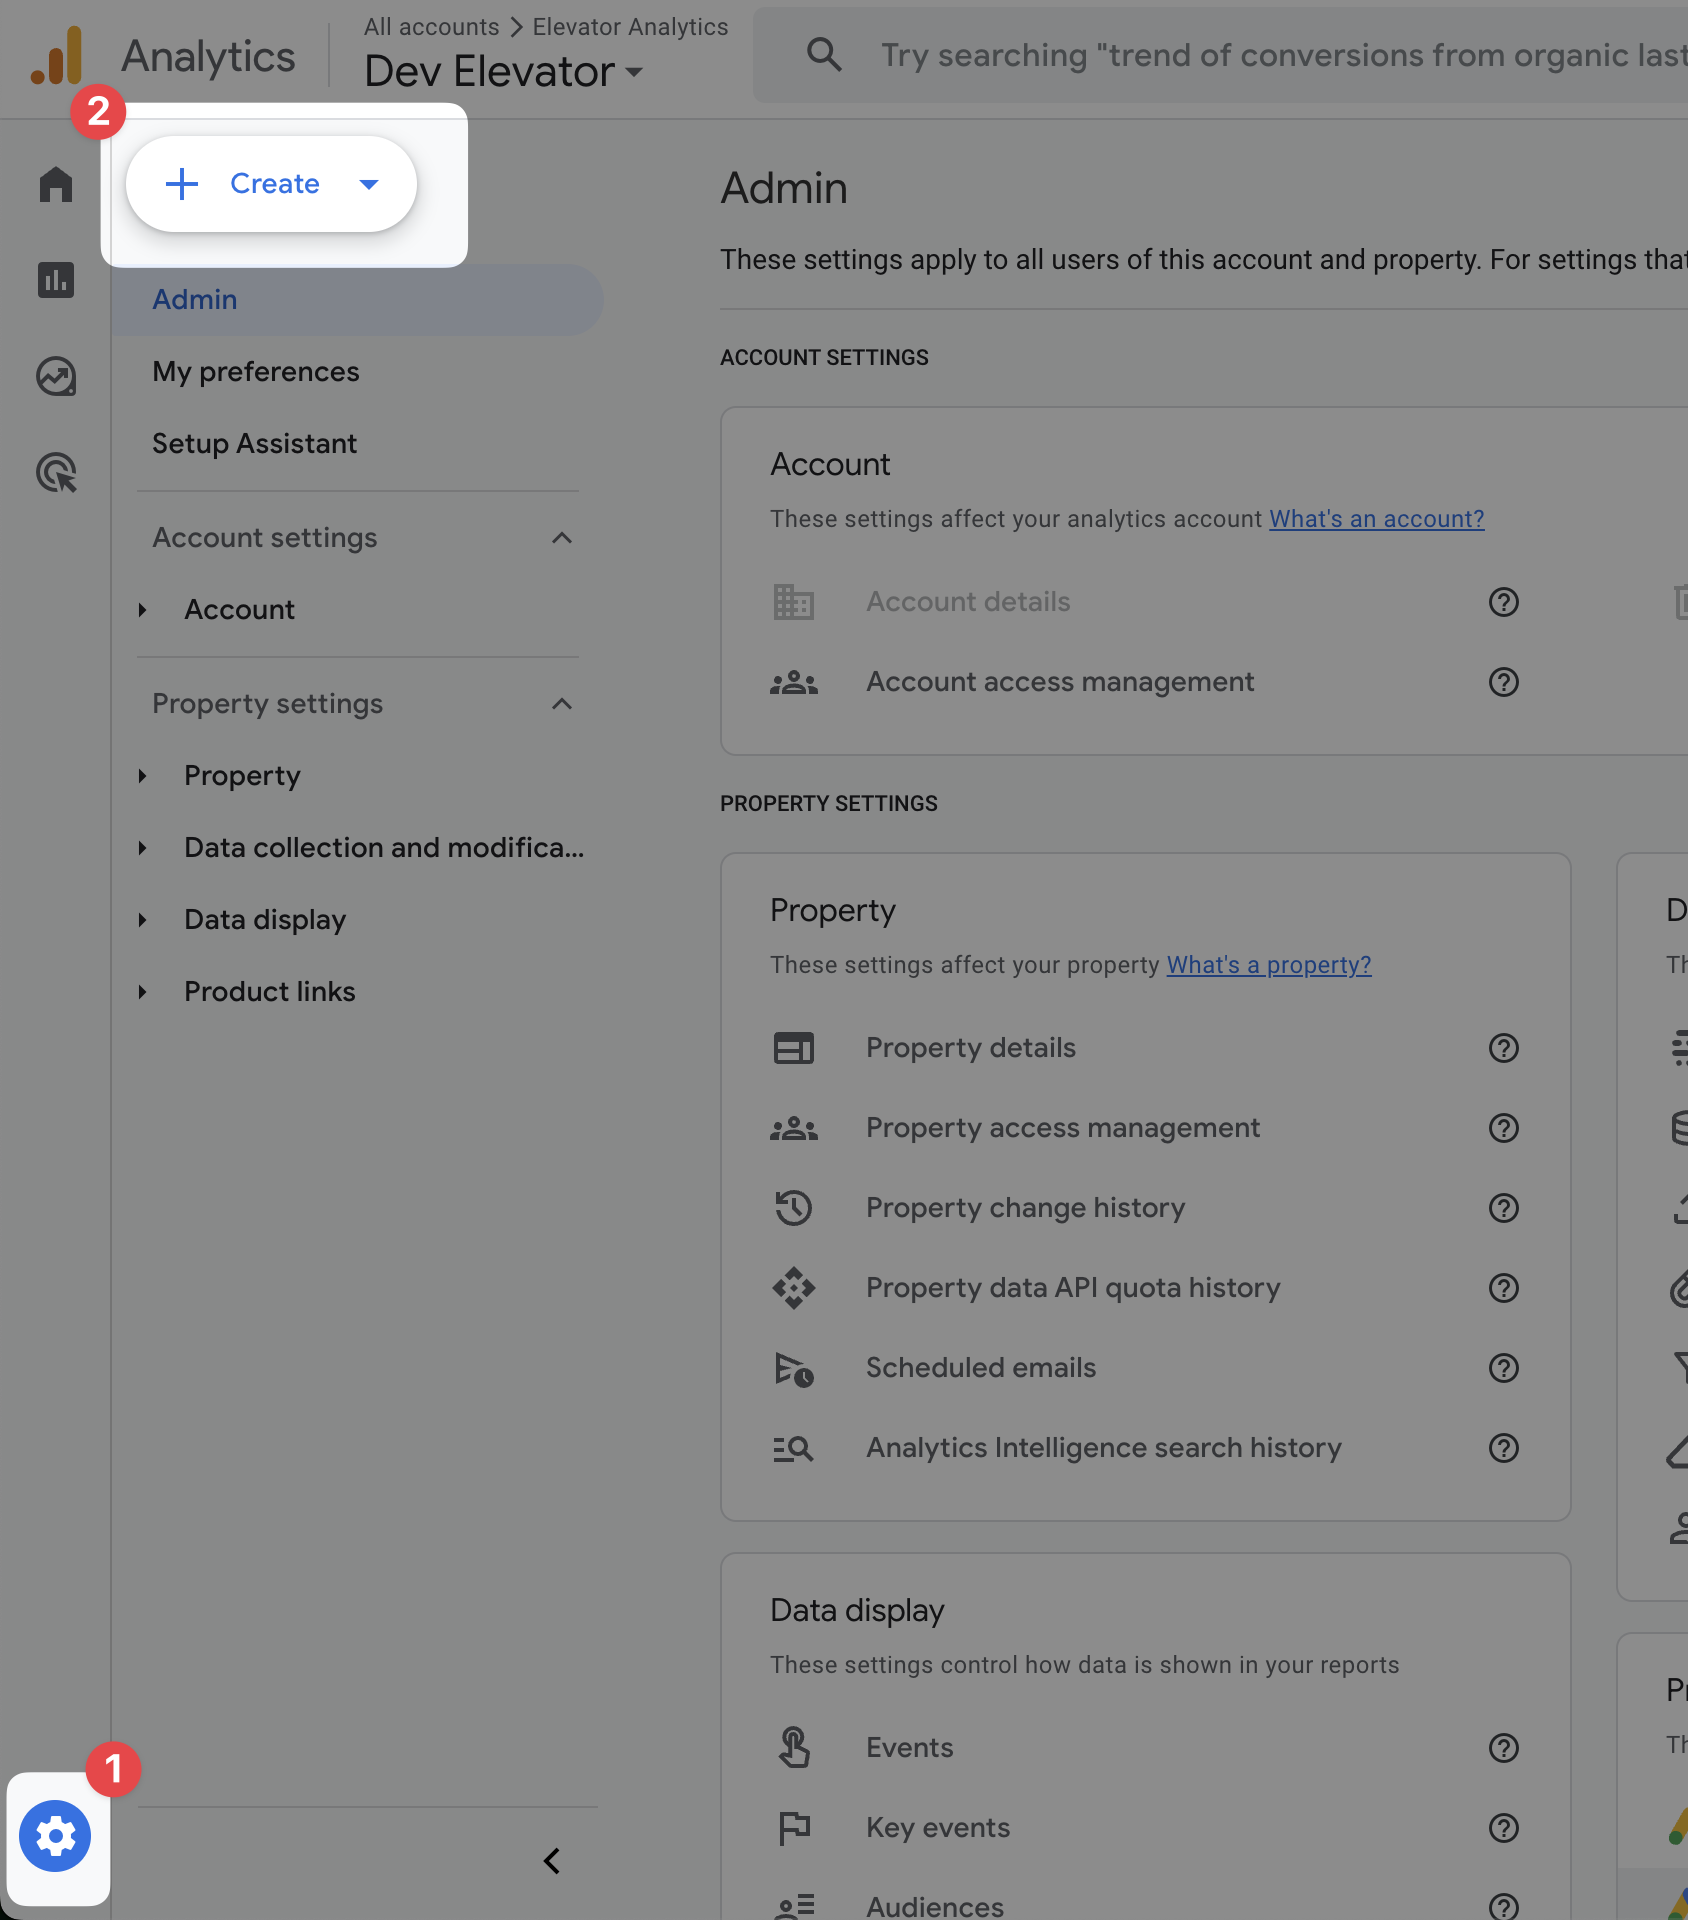
Under
Account Details, enter your organization name, e.g. "UMN College of Liberal Arts".Under
Account Data Sharing Settings, choose if you wish to share any data, otherwise uncheck all the boxes.Click
Next.
# Create a Property
Within Google Analytics, each website you wish to track is called a "Property".
Under
Property Name, enter your elevator instance name, e.g. "dcl.elevator.umn.edu".Set your time zone, and click
NextAnswer the questions under
Business Details, and clickNextSet you
business objectives, e.g. "understand usage"Review and accept the
Terms of Serviceif you wish.Under
Start Collecting Data, chooseWeb, then:- Enter your website url, e.g.
dcl.elevator.umn.edu - Put your instance name as the
Stream name, e.g.UMN Digital Content Library - Be sure
Enhanced Measurementoption is checked to gather page views and downloads.
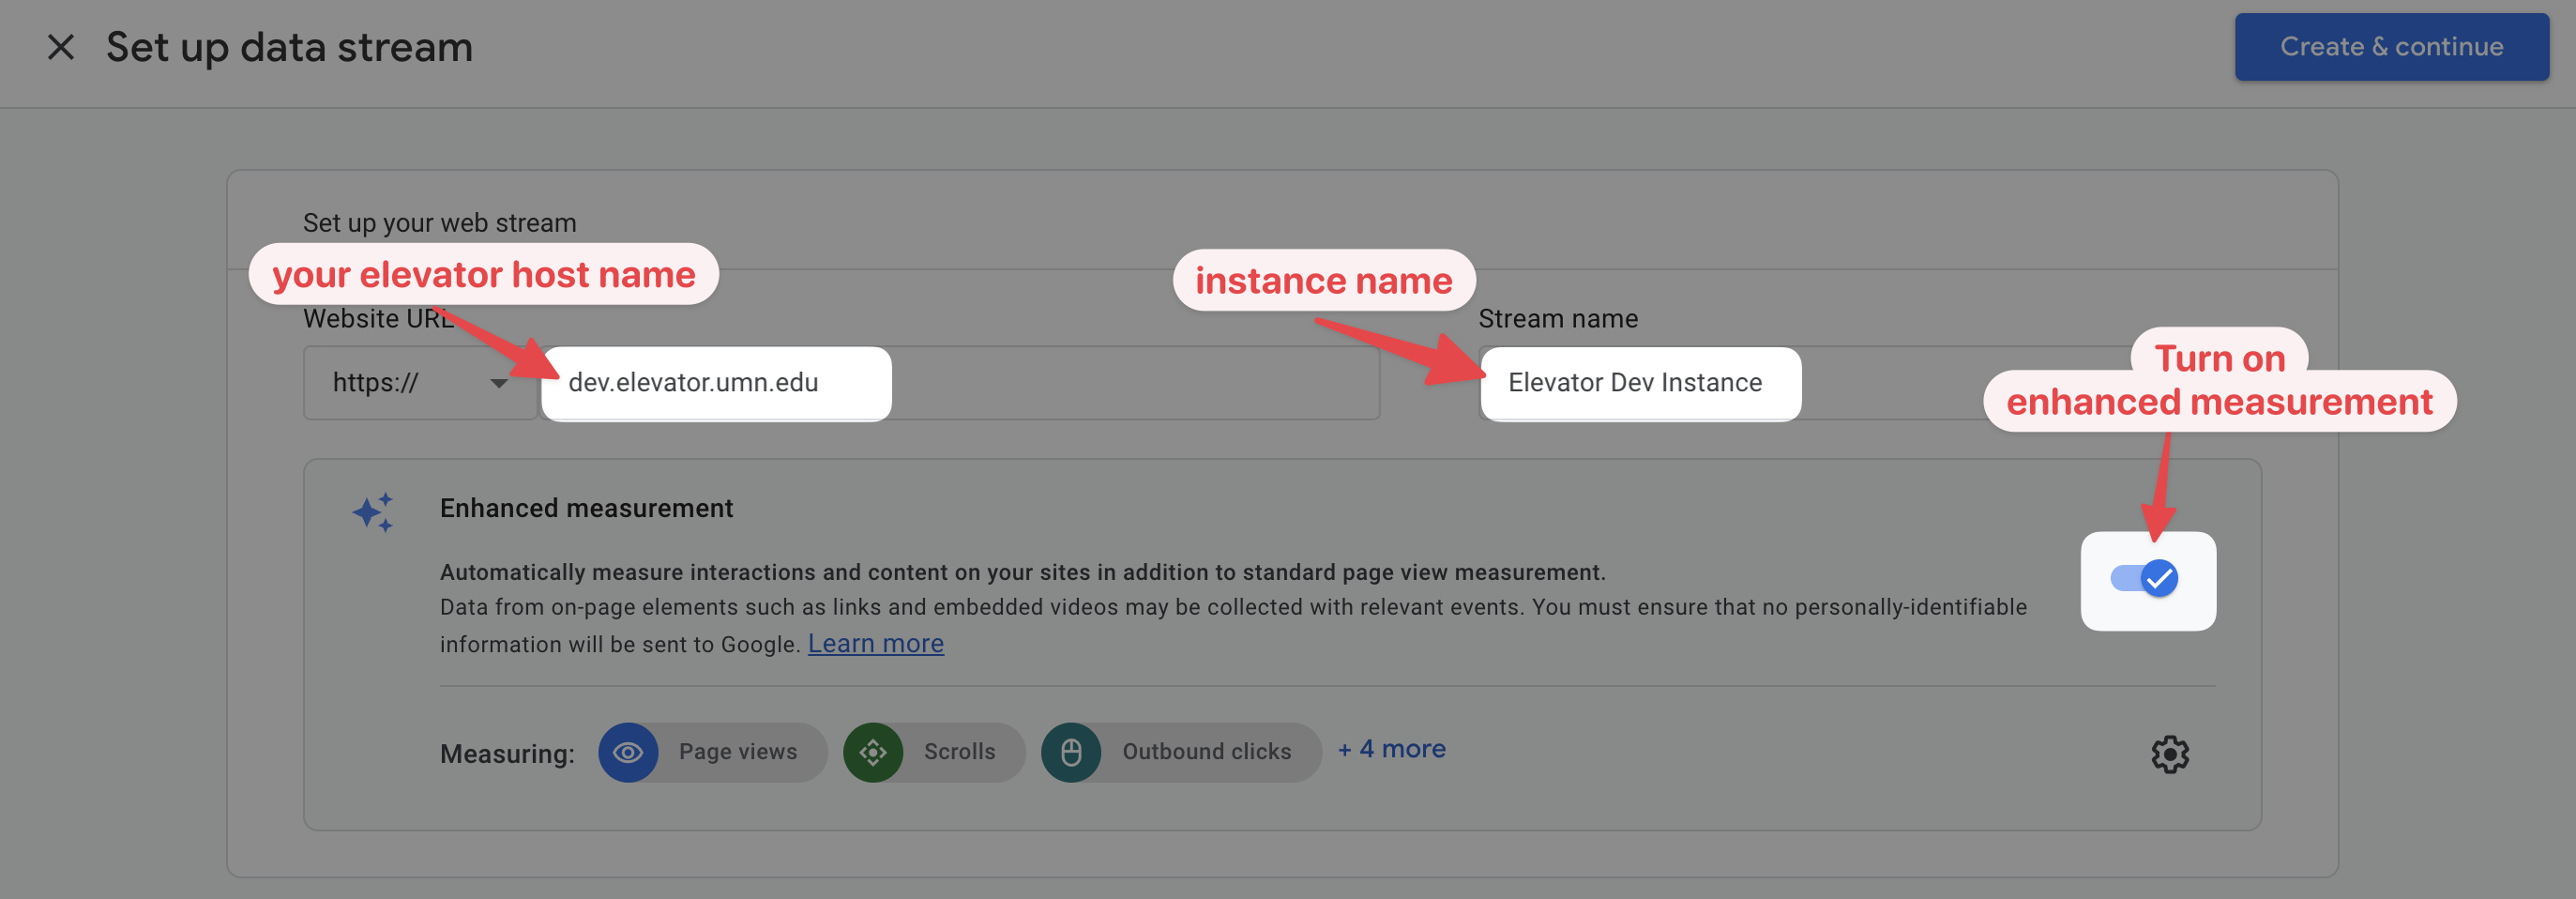
- Enter your website url, e.g.
Finally, click
Create & Continueto generate your elevator instance.
# Set up Custom Dimensions in Analytics
In addition to default analytics info like page views, you can get Elevator-specific data about assets, collections, and file downloads if you set Custom Dimensions in Google Analaytics.
Go to
Admin > Data Display > Custom Definitions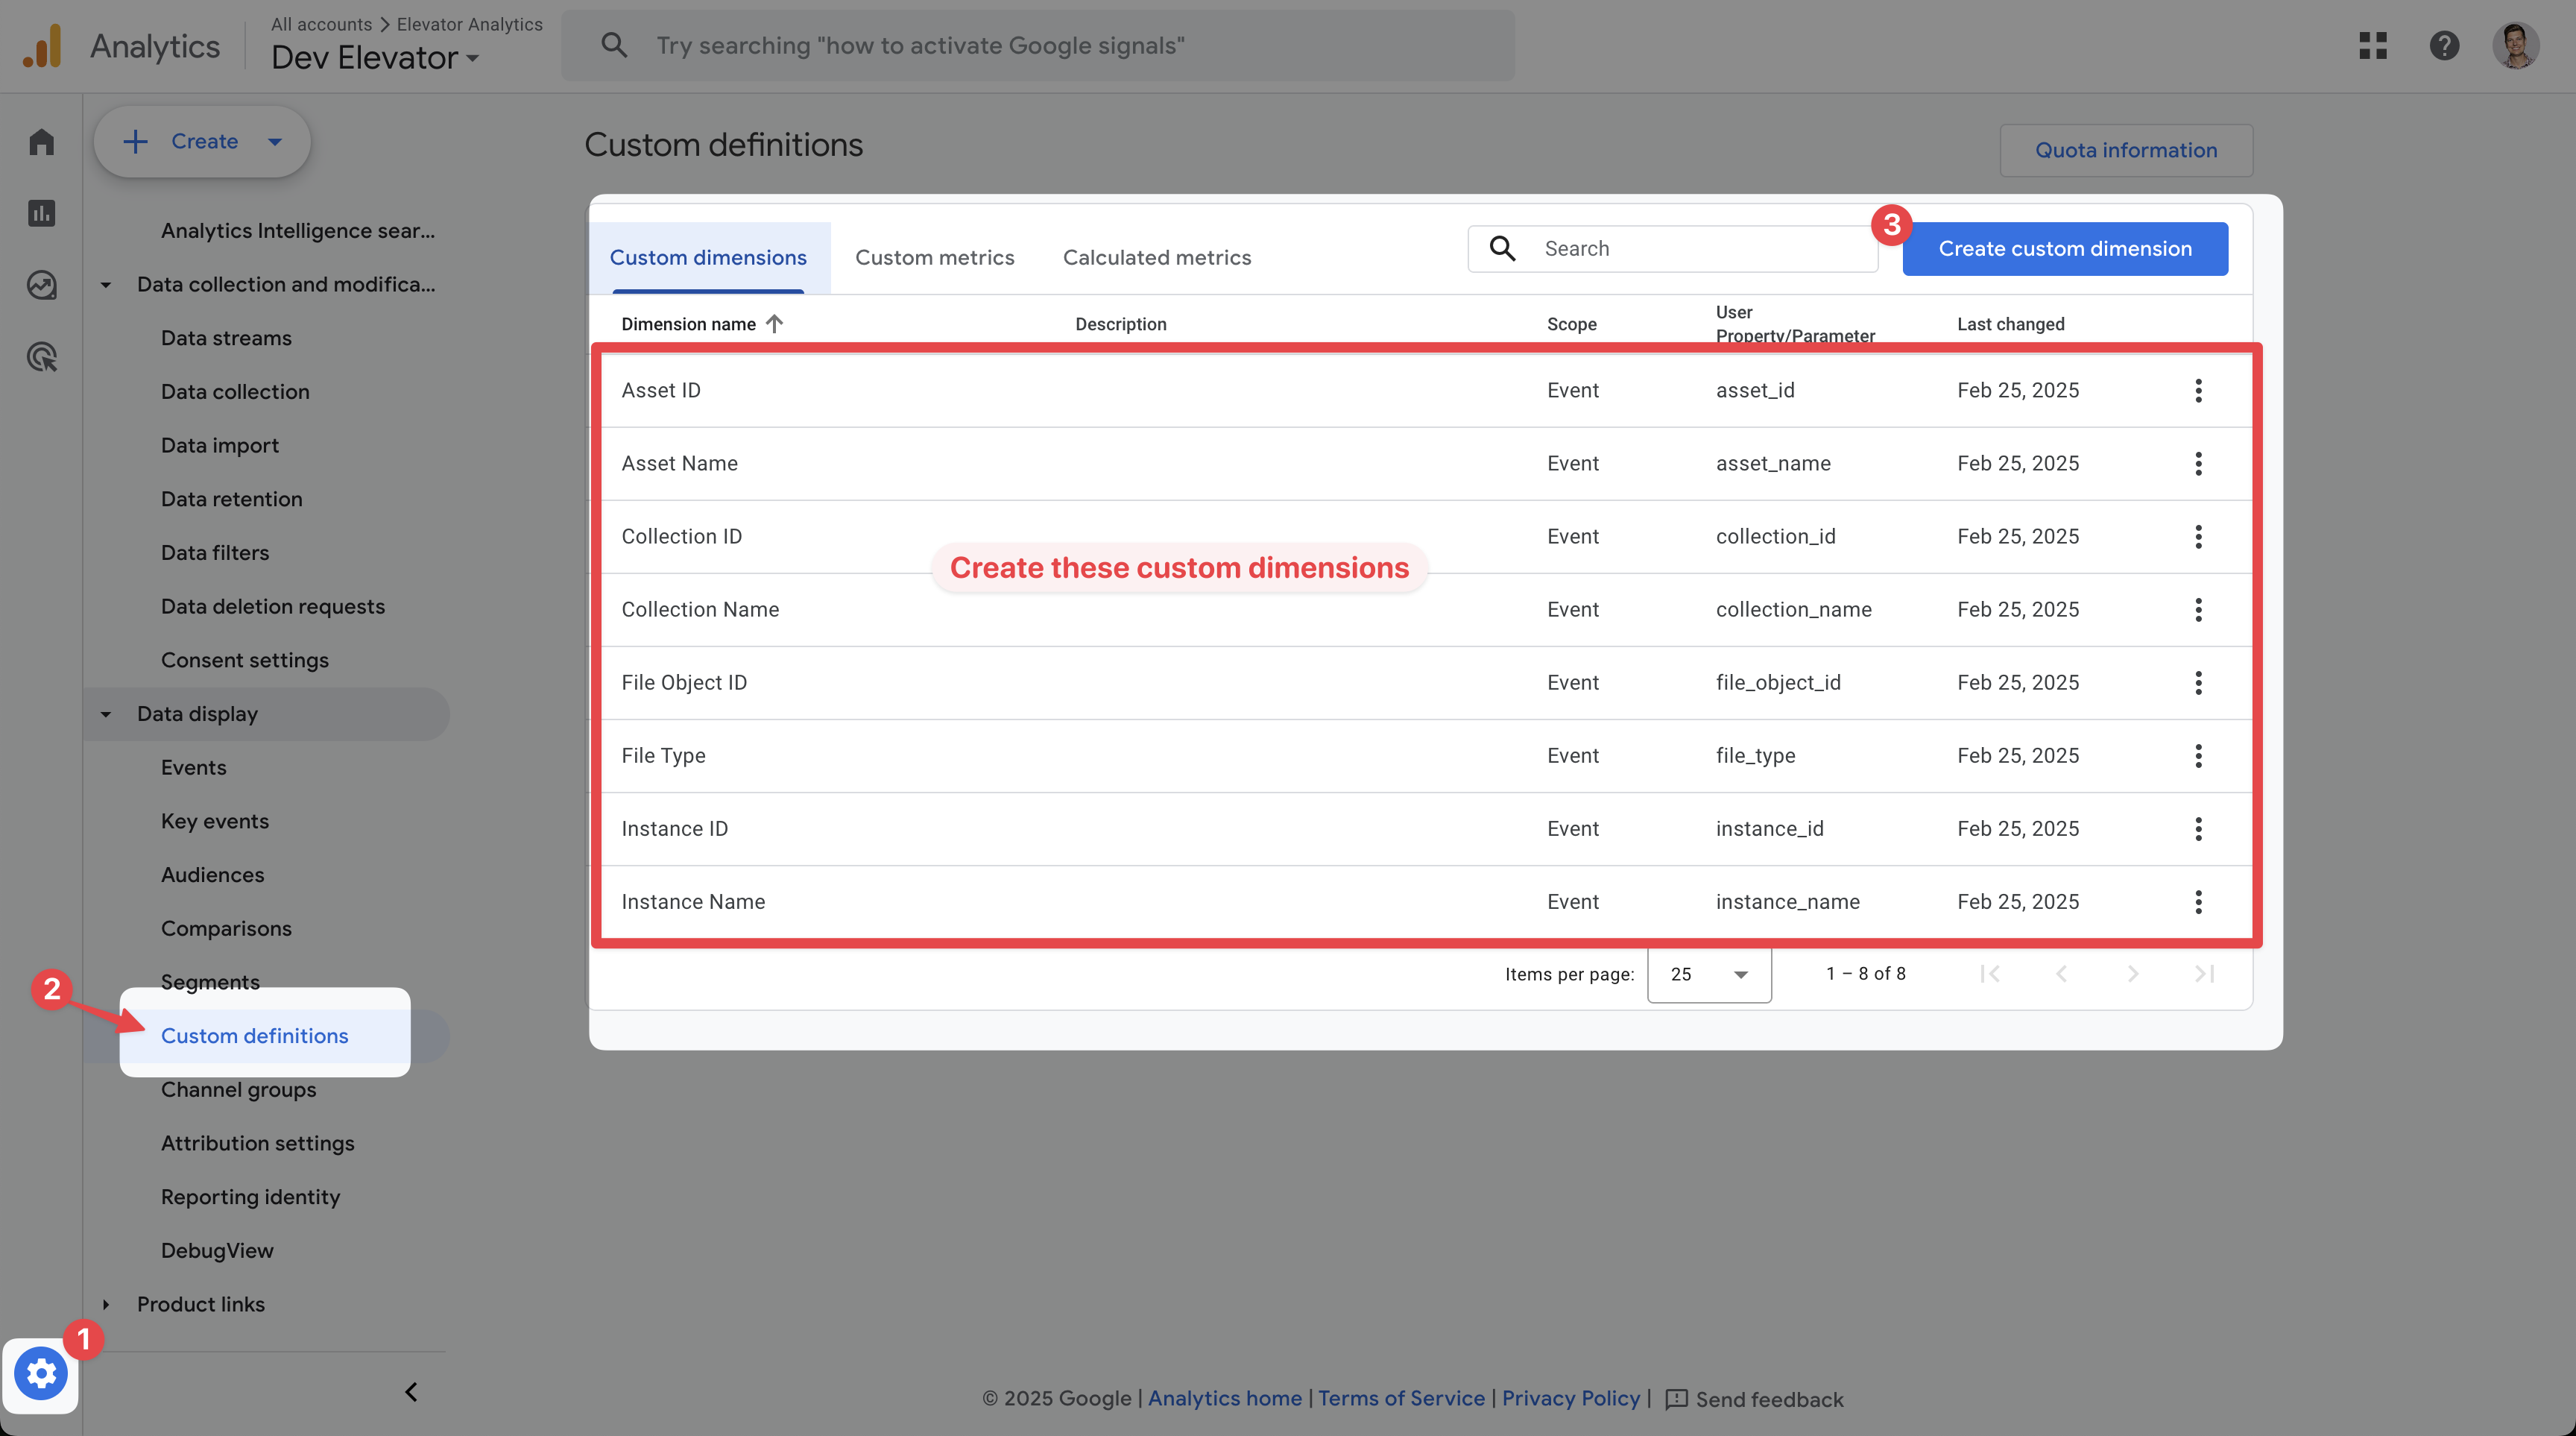
Under
Custom Dimensionstab, create the following custom dimensions:
| Dimension Name | Scope | Event Parameter |
|---|---|---|
| Instance ID | Event | instance_id |
| Instance Name | Event | instance_name |
| Asset ID | Event | asset_id |
| Asset Name | Event | asset_name |
| Collection ID | Event | collection_id |
| Collection Name | Event | collection_name |
| File Object ID | Event | file_object_id |
| File Type | Event | file_type |
# Set Measurement ID in Elevator
In Google Analytics, go to Web Stream details. (This may pop-up automatically after creating a new property.)
Go to
Admin > Data Streams
Choose your the data stream for your elevator instance.

Copy your Measurement ID, something like
G-123456.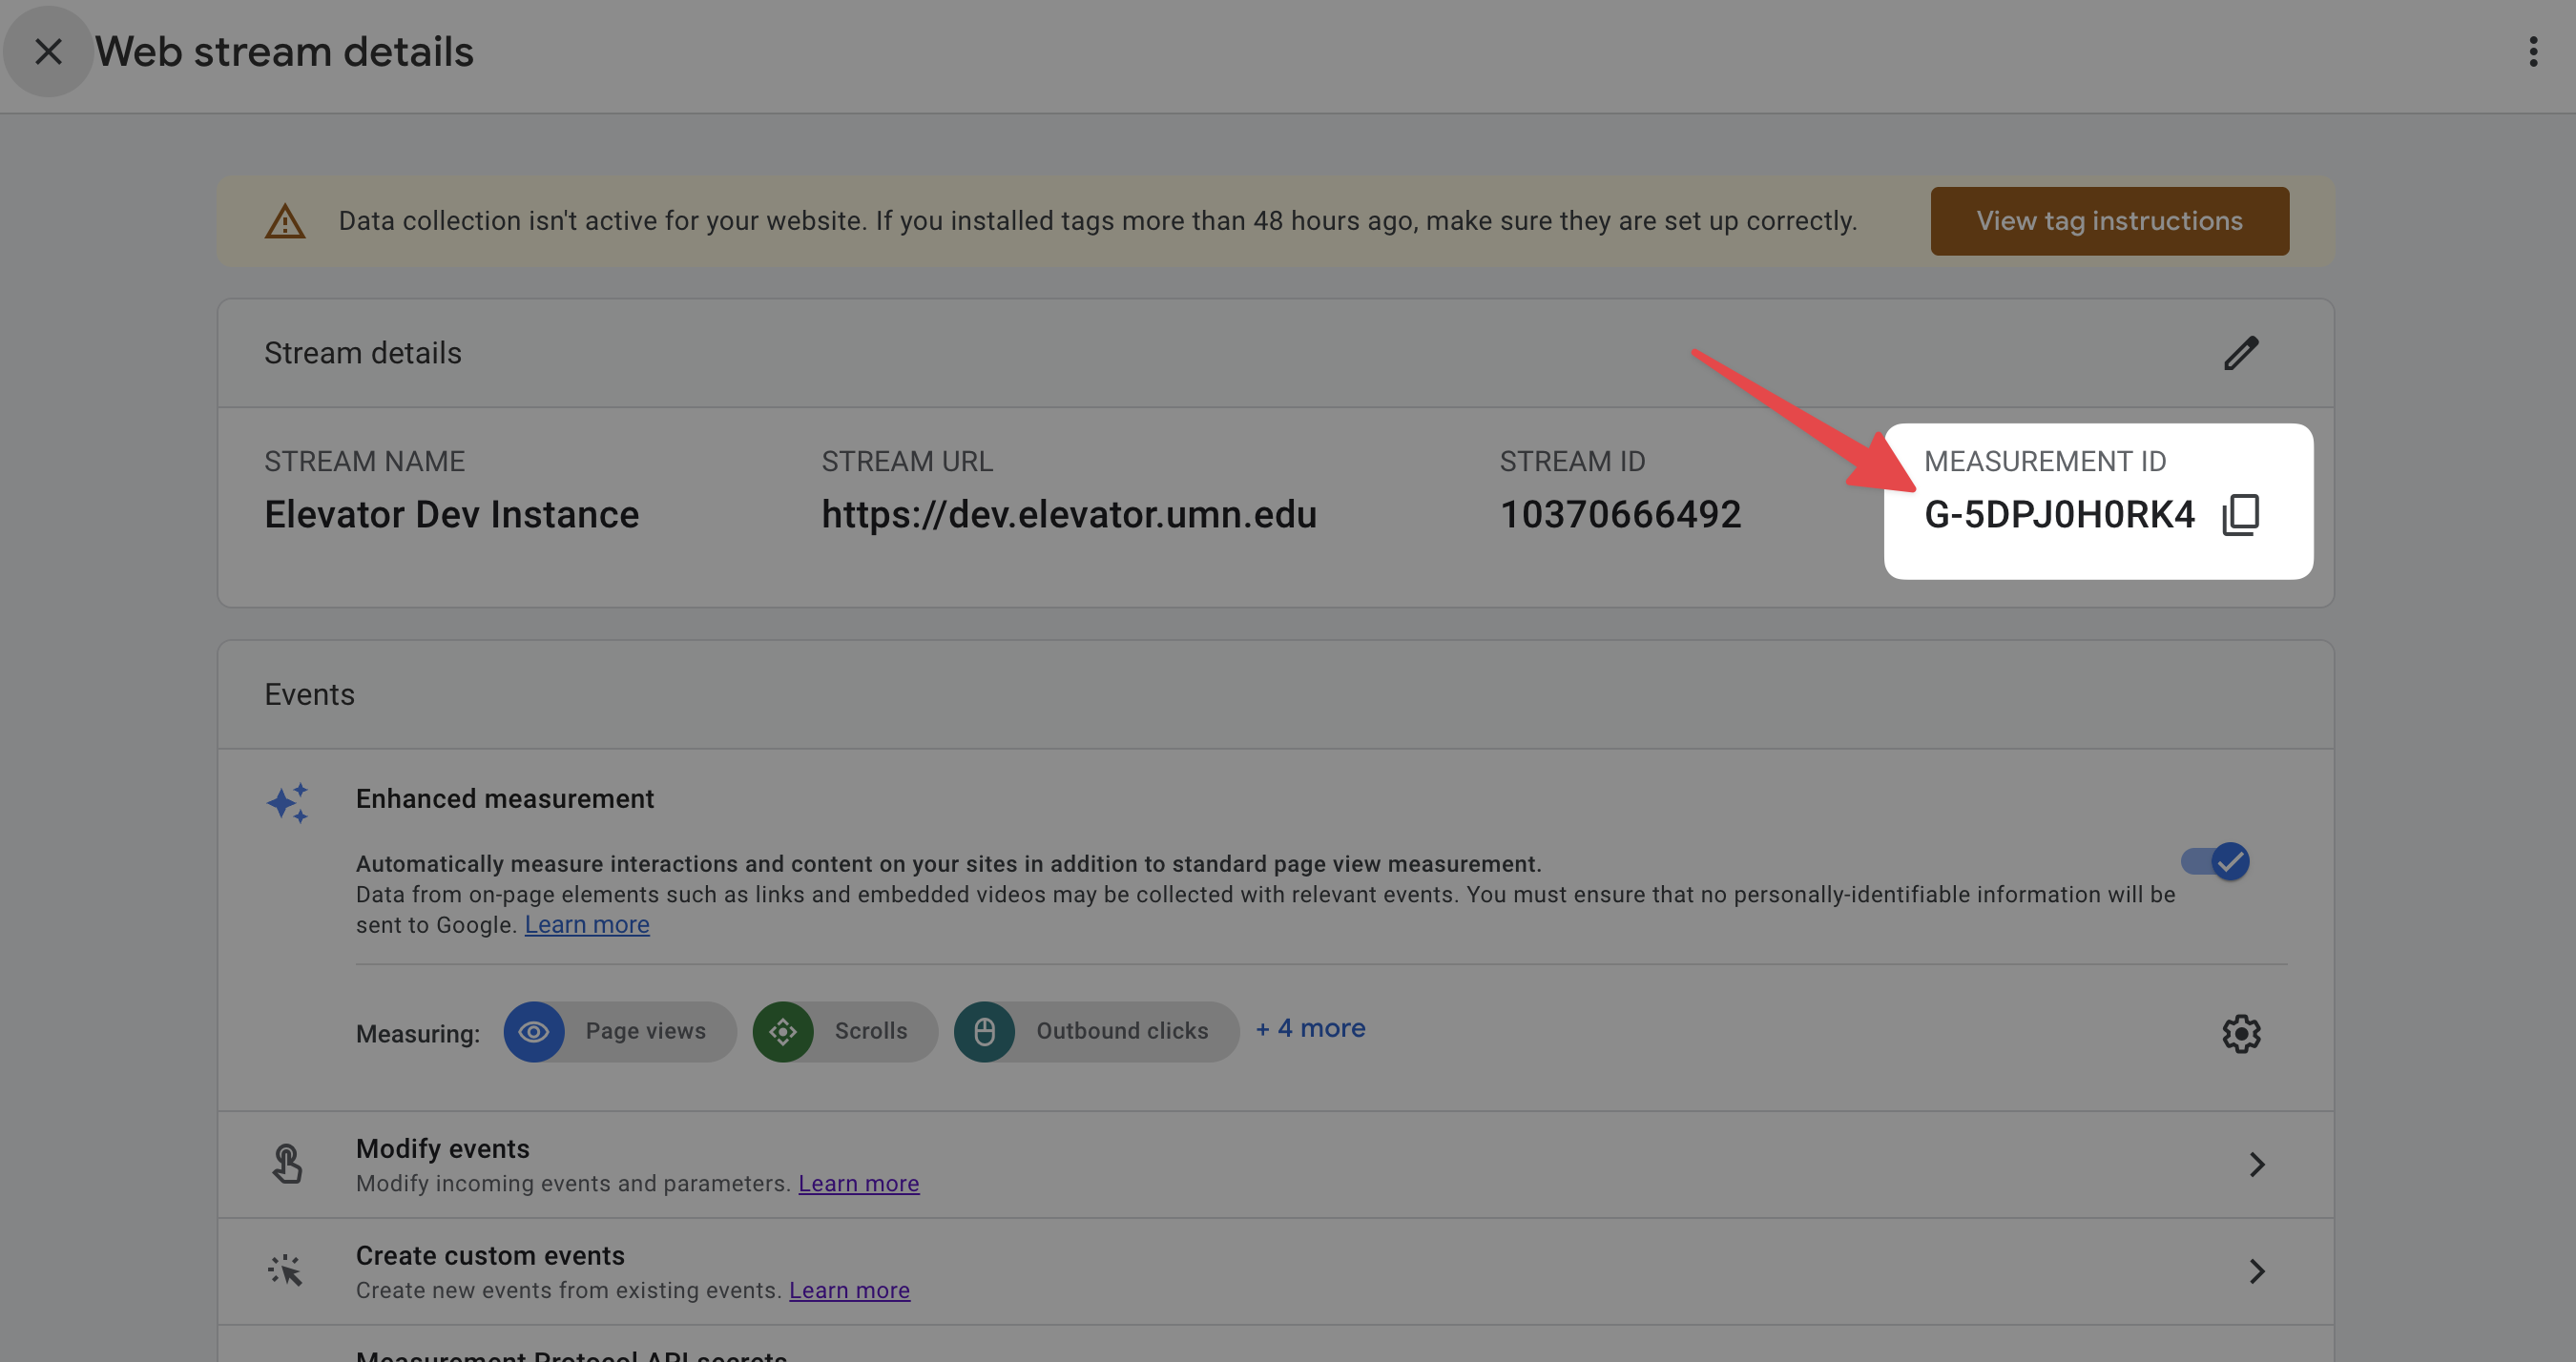
Then, in your elevator instance:
Login to elevator. (You will need to be an admin.)
Choose
Admin > Instance SettingsIn the
Google Analytics Keyfield, paste your Measurement ID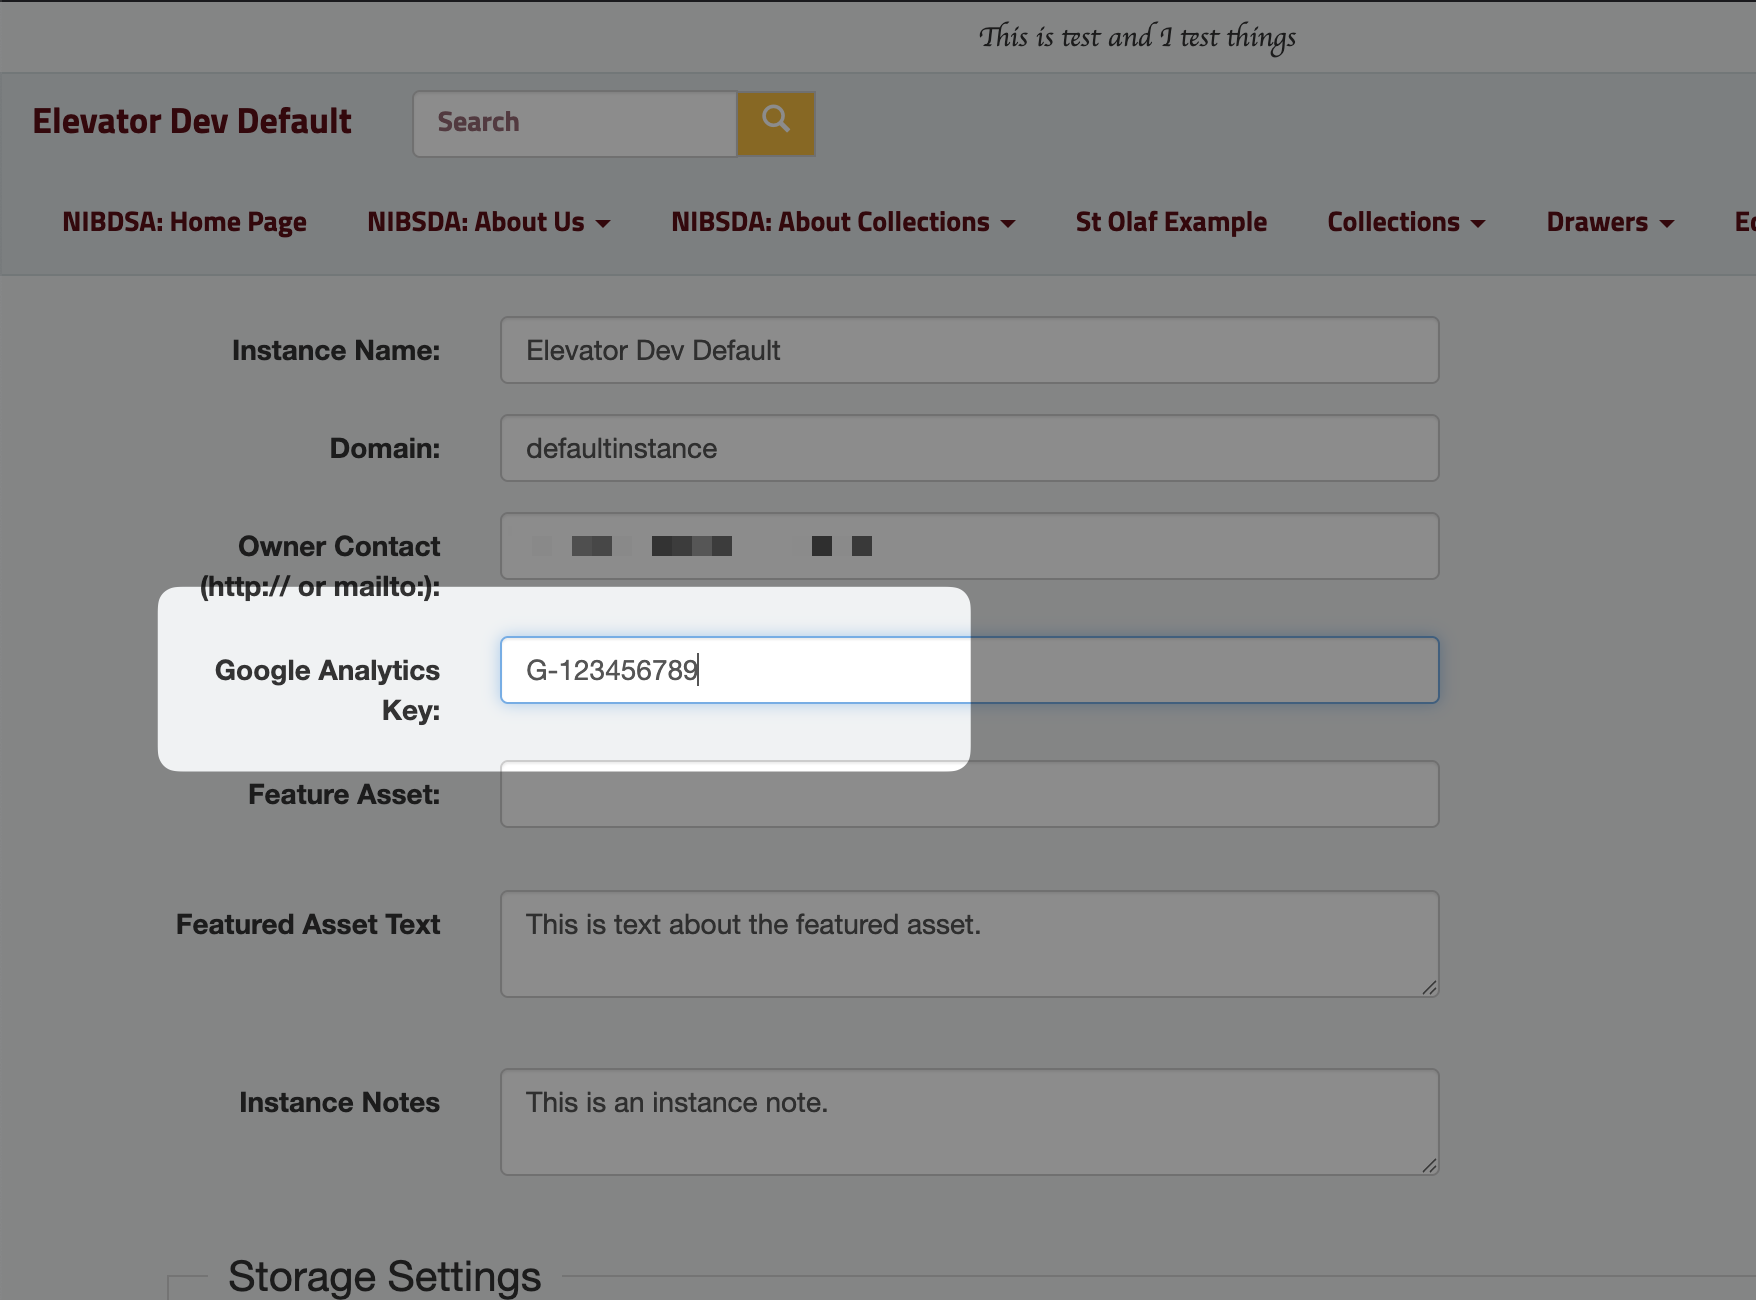
Save
# Verify data is flowing
Back in Google Analytics, you can verify that data is flowing from Elevator to analytics using Google Tag Assistant (opens new window). Tag assistant will open a debug view to show which events are sent.
- Go to tagassistant.google.com (opens new window)
- Choose
Add Domain, and enter your elevator website URL, e.g.https://dcl.elevator.umn.edu. - Click
Connectand tag assistant will open your elevator website in a new window or tab. This window/tab is in "Debug Mode", meaning any events from this browser window will show up in the Tag Assistant window. - Click around, or enter a search term in the Elevator window. In the tag assistant you should see the events.
NOTE: Some browsers (e.g. Brave) will block transmitting analytics data by default. If you're testing your elevator site, be sure to disable this feature temporarily.
# Reporting
- Under
Reporting, you should see activity in theRealtime overviewandRealtime pagesreports shortly after Google Analytics is set up. - It will take 24 hours before you'll have enough data to create custom analytics reports.
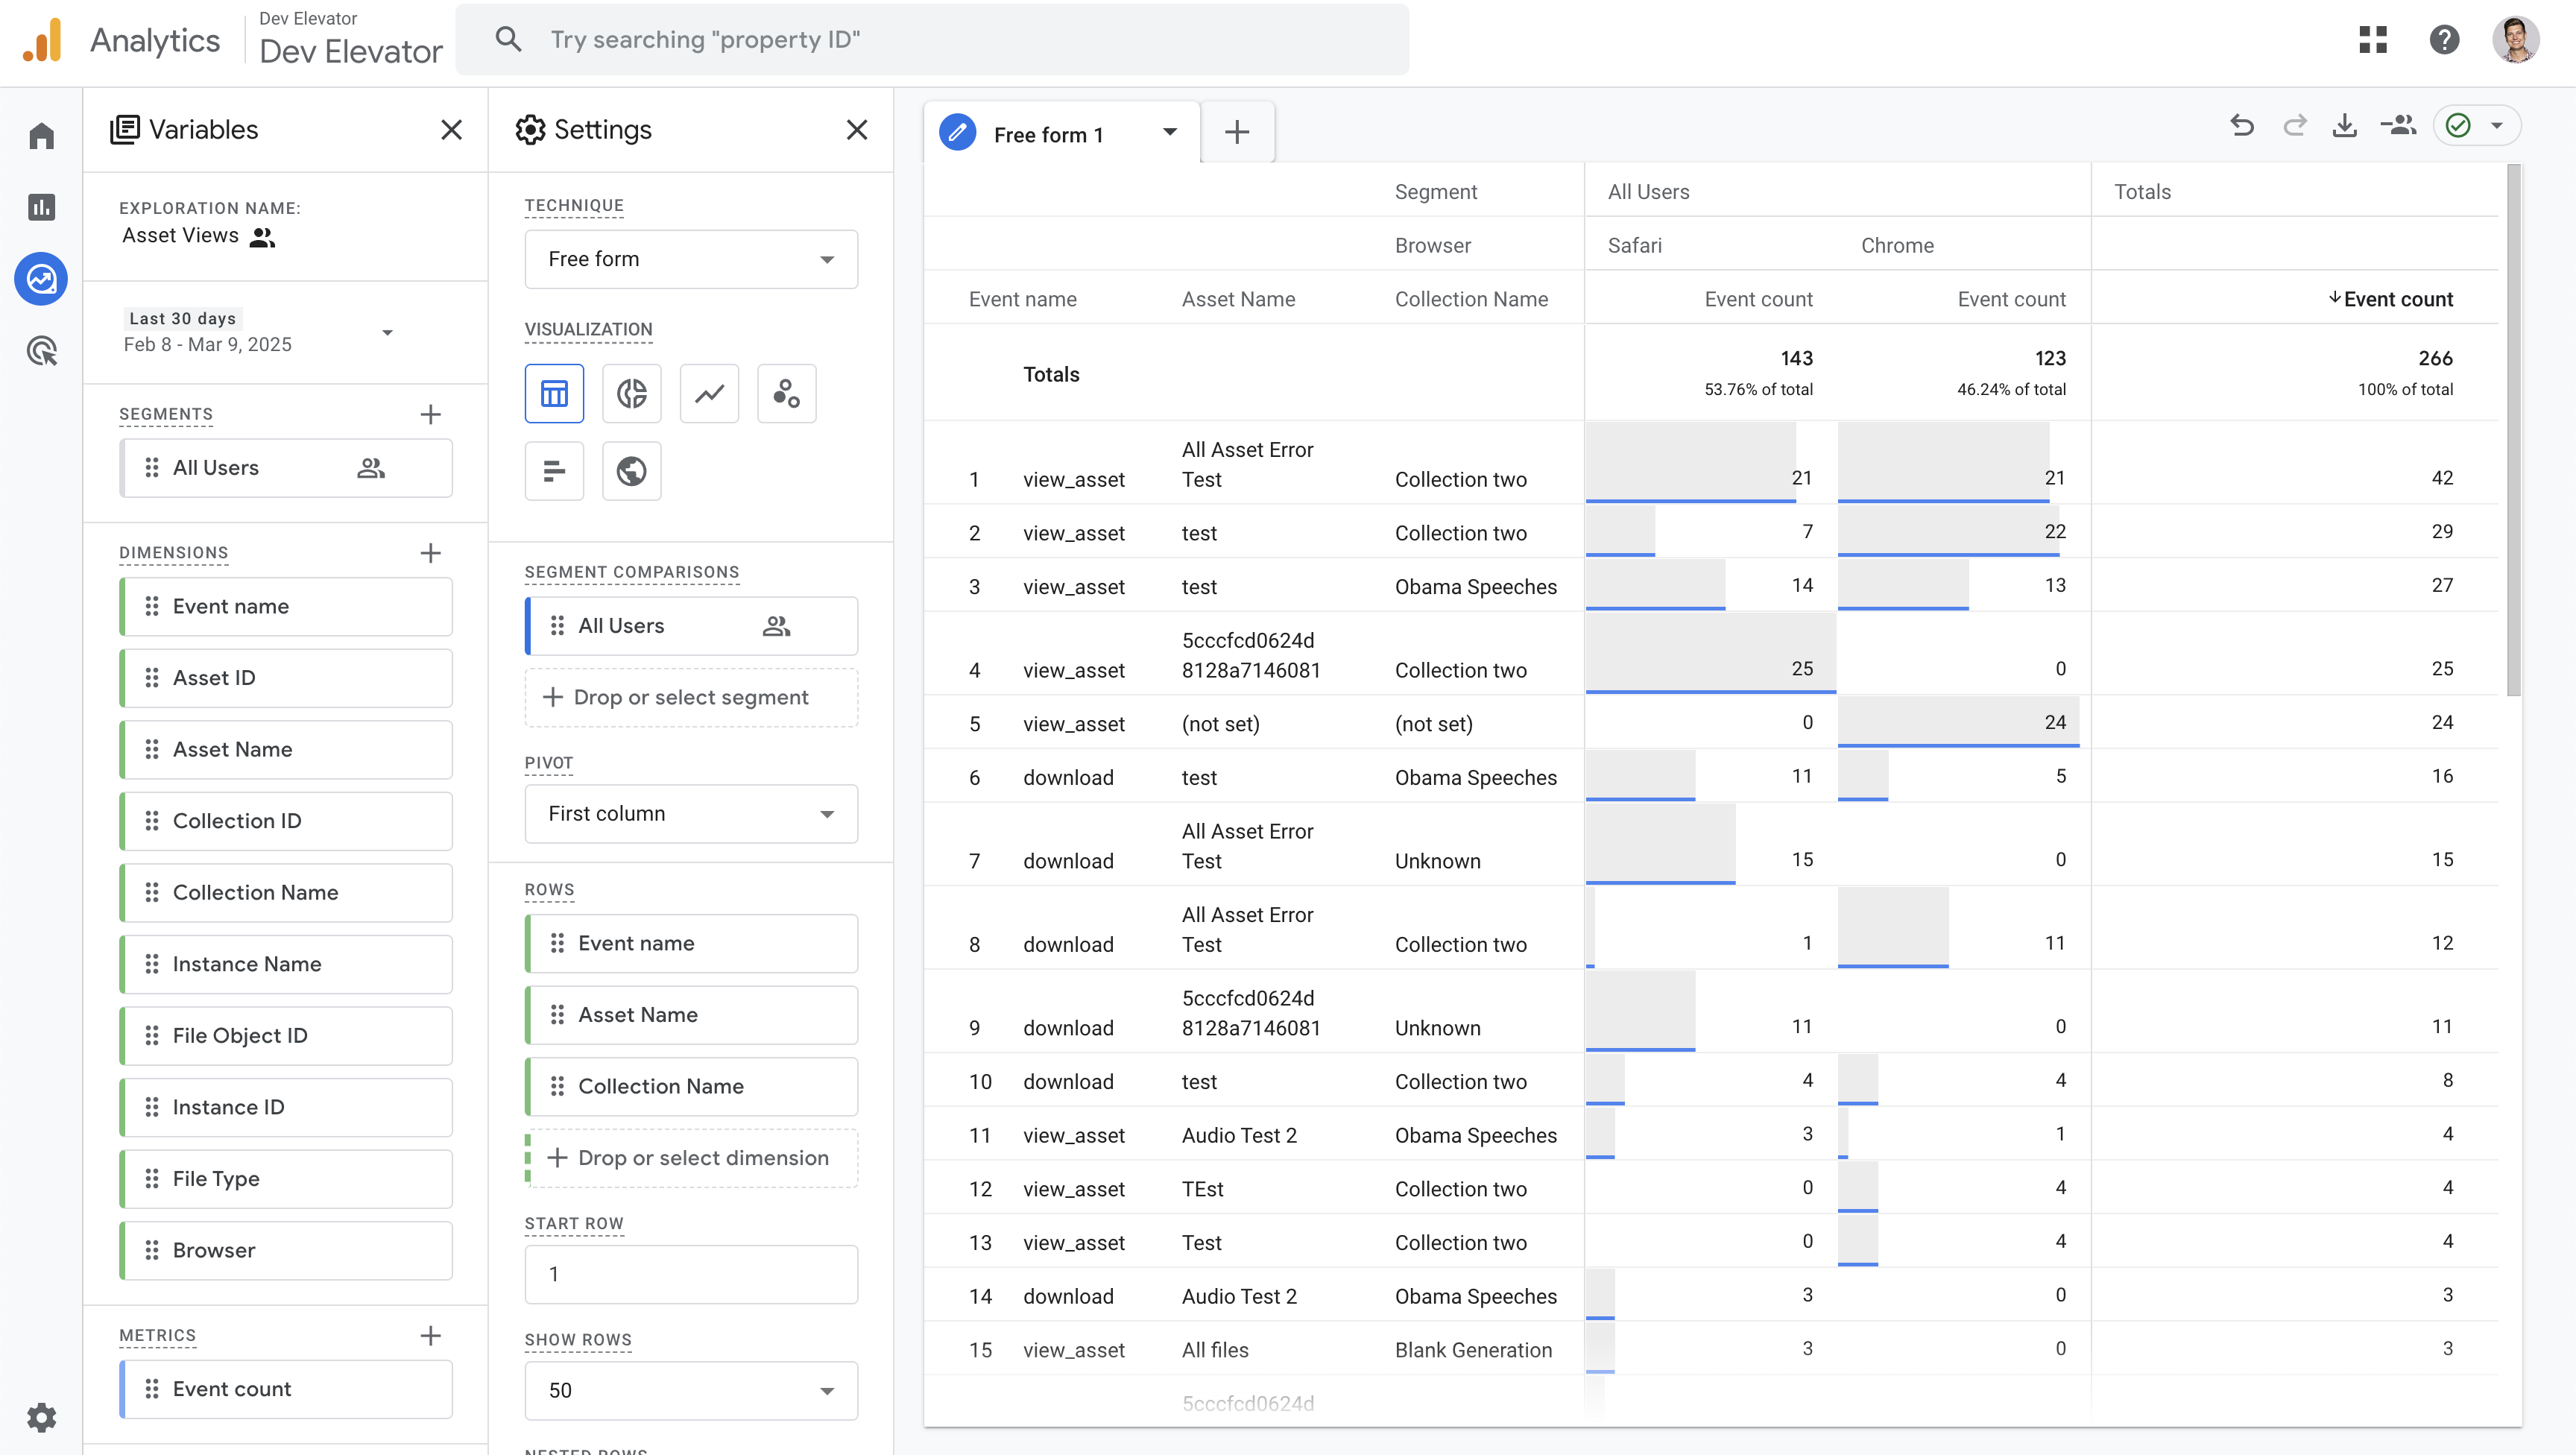
Above is an example of a report using elevator data for asset and collections. To set up a report like this yourself, go to Explore > Blank, and then set:
VARIABLES:
- Date: Last 28 days
- Segments:
All Users - Dimensions:
- Under
Event:Event Name - Under
Custom:Collection Name,Asset Name
- Under
- Metrics:
Event > Event Count
SETTINGS
- Segment Comparisons:
All Users - Pivot: First Column
- Rows:
Event NameCollection NameAsset Name
- Values:
Event Count
You can use Filter to limit results to specific events.